The interests of property sellers (vendors) and the interests of their real estate agent can be better aligned. Firstly, this article shows how the “x% on sale price” commission model fails to reward agents for the effort required to find the highest paying buyer for a property and leads to agents overquoting the expected property price. And secondly this article, proposes a “Shared Outcomes Commission Rates” model that more closely aligns the interests of the agent, with those of the seller. You can try it out here.
x% on sale price commission model
The “x% on sale price” commission model rewards the agent with a percentage (for example 2.5%) of the sale price. If the property sells for $1M then the agent’s commission would be $25K.
This commission model doesn’t reward the effort required by an agent to find the buyer who will pay a higher price. Let’s say that to sell the property at the expected sale price of $1M it takes an effort. If the agent doubled their efforts (or worked twice as smartly) to find the best buyer, would we expect the sale price to double to $2M? Hardly! It might sell for $1.1M or $1.2M or more depending on the context. This means that the doubly hard working (or doubly smart working) agent is at best rewarded +10% or +20% in their commission from the sale. The effect of this commission structure is that the smart agent will do just enough to attract a reasonable purchase offer and move on to the next sale.
As well, the “x% on sale price” commission model leads to conditions where an agent can raise the vendor’s expectations of the achievable sale price for the purpose of securing the agency for the property. The vendor’s interests are in a higher sale price, and the “x% on sale price” commission model means that even if the agent is only able to deliver an ‘average’ rather than ‘excellent’ result, the agent’s commission may only decrease by a small margin.
Let’s explore the root of these issues.
The bulk of the reward is for hardly any effort
If the vendor was willing to accept 80% of their property’s value it will sell itself. Why is it a promising idea to base 80% of an agent’s expected reward on just the fact that the vendor signed up with this particular agent?
Before moving on to more detail, please be assured that I am not trying to argue that agent commissions are too high or too low. Just that agent effort is not being rewarded where it delivers value.
My main question is this “Can we structure commissions so that the extra agency effort required to achieve a 110% or 120% sale price are rewarded properly?”
Rewarding agent effort
A “sale within some time period for 80% sale price” can be achieved with minimal agency effort. Let’s imagine a commission structure that promised the agent a minimal reward for that outcome and instead shifts commission to reward the effort required for more than the minimal outcome.
Moving the sale price from 80% of expectation to 100% will be possible at some level of agency effort and for double the agency effort the sale price might be moved from 100% of expectation to 110% or 120%. It would be good if that extra agency effort were rewarded by a commensurate increase in commission.
Another desirable feature of such a pricing structure is that the agent will be reluctant to recommend that a property be sold below the expected price, because their commission would fall away rapidly. A 10% fall in price might mean that the vendor gets 90% of the value of the property but the agent only gets 50% of their expected commission.
Agent motivation to fairly represent the expected sale price
Under the “x% on sale price” commission model, an agent can use a 10-20% over-estimation of the sale price to secure a listing and thereby gain the uncontested 80% of the commission.
A vendor is likely to prefer a commission structure would act in such a way that an agent’s failure to achieve the estimated sale price would result in a significant reduction in commission. Under this situation, an agent’s desire to overquote to secure the business would be balanced by their assessment of their ability to deliver the estimated sale price.
Tiered Commission Rate approach
One existing approach to addressing these concerns is tiered commission rates. For example, Open Agent Australia’s 2018 article on “Why we like tiered commission rates.” clearly outlines the challenge and proposes a tiered approach to commissions that addresses them.
However, in practice, it is not easy to set up tiered commission rates. Setting up tiering requires making dozens of inter-locking choices:
- how many tiers should we use,
- at what point should our tiers start and finish,
- how much should we increase the commission at each tier?
- And finally once it is setup, how do we communicate the impact on the agent and vendor of these decisions.
The Shared Outcome Commission Rates approach below vastly simplifies this down to just four decisions. Let’s see how it works.
Shared Outcome Commission Rates
The “Shared Outcome Commission Rates” structure described below is an original contribution by the author. If anyone is aware of this proposal being previously described, I would be happy to add citations to the earlier authors’ works.
A Shared Outcome Commission Rates structure aligns the interests of the vendor and the agent. Here is how is an illustration of how it works. We make four decisions to create the Shared Outcomes Commission Rates Structure
- Base Sale Price. Property is estimated to sell for (example) $1M based information available in the marketplace.
- Commission payable on Base Sale Price. (example) 2.2%
- Estimated Sale Price if agent doubles effort (or works doubly smart). (example) $1.1M
- Maximum incremental commission on additional sale price. Never more that (example) 25c in the dollar of increased sale price.
Using these four decisions Chart 1 shows a commission model that shares the outcomes between the vendor and agent in proportion to the outcomes/ effort.

2.2% at $1M, 4.4% at $1.1M, Max Inc 25%
As you can see from Chart 1. above, a sale price 10% higher will attract double the commission and a sale price 10% worse, will attract a 50% commission of just 1.1%
The straight-line part on the right-hand side of the commission curve is caused by the decision to never allocate more than 25c in any dollar towards commissions.
Try it yourself
A Shared Outcomes Commission Rates calculator is here: https://davidpratten.com/sharedoutcomescommissionrates
Adjusting for market conditions
By way of comparison, if the market uncertainties were higher and a ten percent improvement could just occur by chance but a 20% improvement on the sale price is expected to require double the agent effort then the following Shared Outcomes Commission Rates structure might be more suitable.
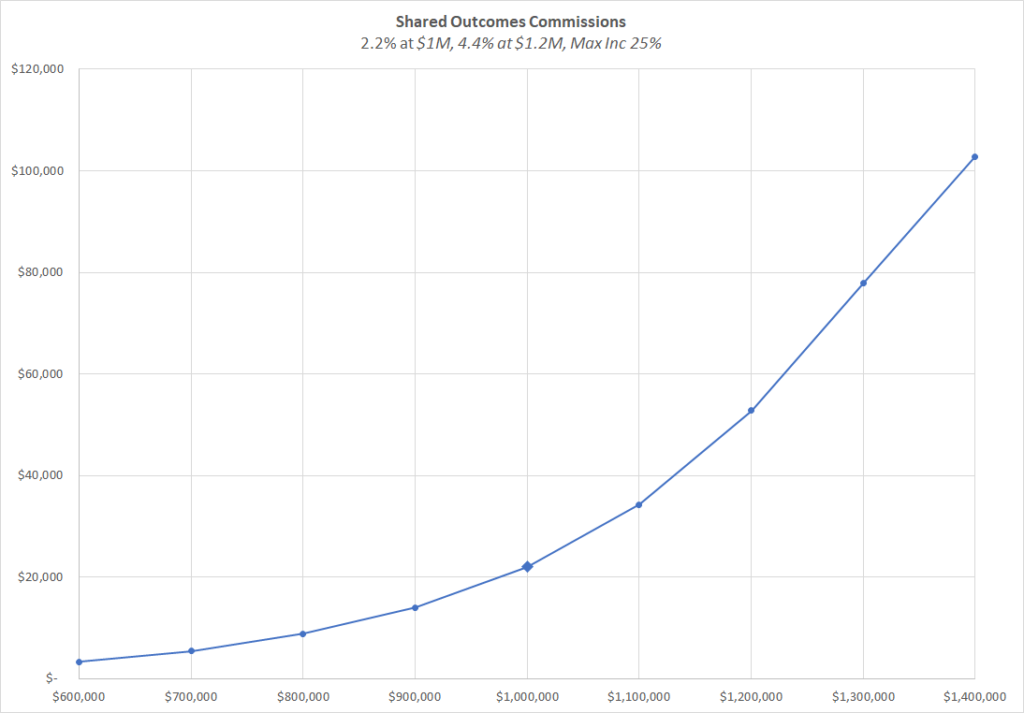
2.2% at $1M, 4.4% at $1.2M, Max Inc 25%
Under this scenario, while the agent has a slower increase in commissions on the upside, it now takes a full 20% fall in sale price to halve the commission payable to the agent.
Impact of Shared Outcome Commission Rates
The author believes that the proposed “Shared Outcomes Commission Rates”, will positively align the interests of vendors and real estate agents.
- Agents are rewarded in proportion to their efforts when delivering superior outcomes. And not rewarded for over-estimating the sale price.
- And vendors are no longer paying 80% of the commission just because they signed up with an agent.
Win – Win.
Try it out … https://davidpratten.com/sharedoutcomescommissionrates